Welcome to Karios’s documentation!#
Python application based on KLT Algorithm for Registration of Images from Observing Systems (KARIOS).
Introduction#
In general, quality assessment processes are fundamental to appreciate how well data is fit for Earth Observation application purposes. Those assessments dedicated to geometric accuracy are rarely open to community. As a consequence, it is difficult to inter-compare data based on the same processes and compare results based on harmonized mapping accuracy metrics.
To overcome this situation, thanks to funding of ESA / EDAP project [RD-8], the KARIOS initiative has been launched and a user tool is now available.
The KARIOS tool has been designed to analyse geometric deformations within optical and radar images. For this purpose, the tool performs image matching and generate several key graphical representations and compute accuracy statistics.
Image matching process does not follow traditional approach because it is based on feature point matching (corner). A KLT implementation [RD-9] available in OpenCV library is used in KARIOS. Also, the candidate point selection is done with GoodFeaturesToTrack function and matching is done with calcOpticalFlowPyrLK function.
As shown in the following picture, KARIOS makes KLT algorithm compatible with remote sensing images embedding suitable pre-processing (image filtering) and post-processing (outlier filtering).
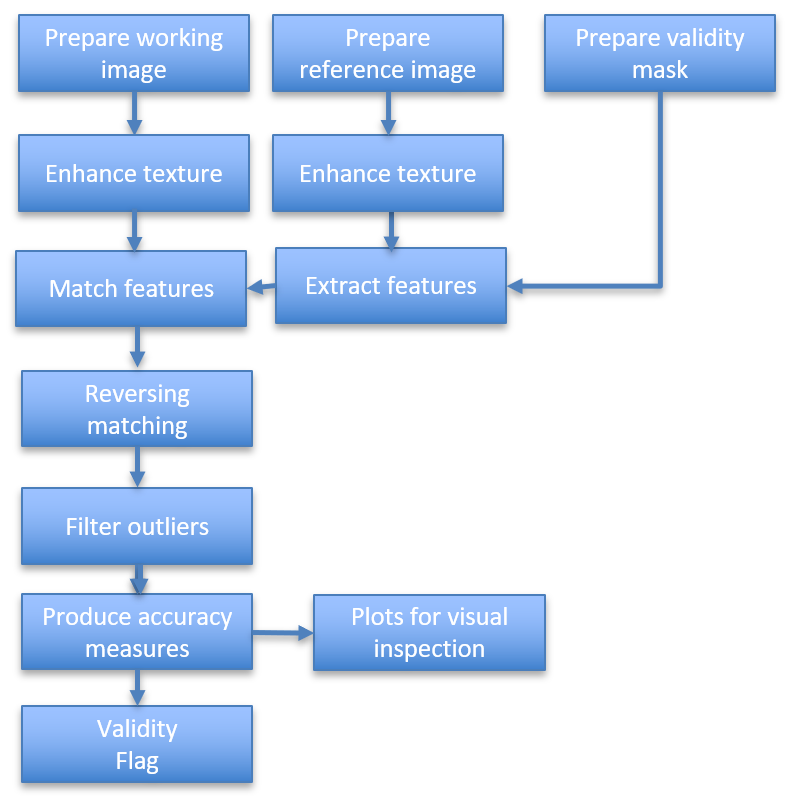
KARIOS process overview#
As an optional and experimental feature, KARIOS has the capability to detect large shifts between images. If a large shift is detected, the monitored image is shifted according to the offsets found, and the KLT matching is applied.
To enable large shift detection, use –enable-large-shift-detection program argument. Please note that it could use lot of memory in case of large images such as Sentinel2 10 m bands, e.g. 11GB for band B04.
Furthermore, KARIOS analyses displacements between the two input image grids in both line (along-track) and pixel (across-track) directions, providing user with the three following items:
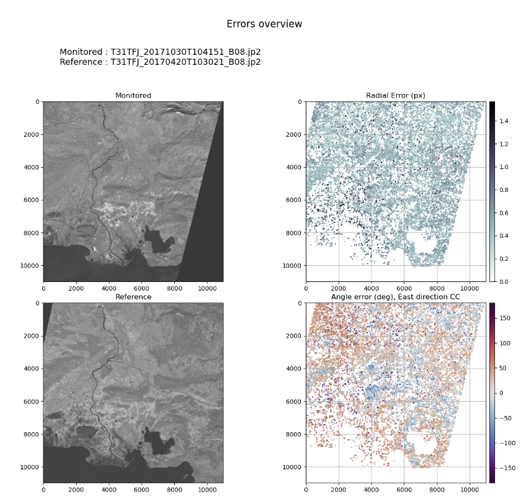
Error overview#
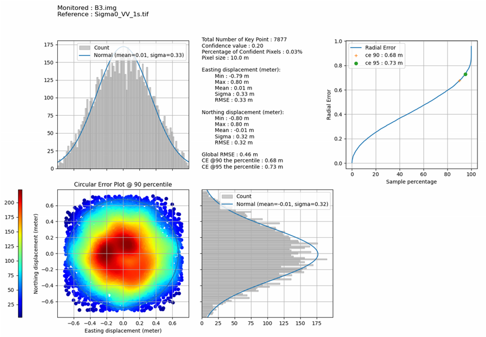
Statistical report#
Disparity map#
The geometric accuracy report includes the following accuracy metrics, in both directions when relevant:
Root Mean Square Error
Minimum / Maximum Error
Mean Error
Standard deviation Error
Circular Error @90 percentile
The Circular Error (CE) at the 90% level confidence graphic is used for horizontal accuracy in image products.
This representation is relevant for images expressed within cartographic system grid. Thanks to the CE representation, it is straightforward to evaluate mapping accuracy, considering reference data with known accuracy.
In case of images with no cartographic system grid, the CE graphic representation becomes less informative. The CE graphic is still generated, and equally spaced sample data is assumed. This hypothesis is not obvious, when details on image grids are unknown.
Getting started#
Prepare your environment to install and run KARIOS.
Install KARIOS.
A few examples showing how to run KARIOS.
Case studies#
This section contains multiple examples of KARIOS usages, featuring different imaging sources (Landsat MSS, PROBA/CHRIS, SKYSAT, …) showing how to use and analyse the tool’s results.
Visit Case studies page
Cookbook#
Learn how to understand KARIOS outputs and configure the parameters to achieve your goal.
Visit Case Cookbook page
References#
Visit References page
Note
You can cite KARIOS Tool by using Saunier, S., Canonicy, P., Louis, J., Debaecker, V., & Albinet, C. (2024). KARIOS : A fast & efficient open source tool for geometric deformation analysis (1.0). The Very High-resolution Radar & Optical Data Assessment (2023) Workshop (VH RODA), ESA-ESRIN, Frascati (Italy)
Many thanks to Telespazio for this open source tool.