Understand KARIOS output data and plots#
This section reviews all the outputs generated by KARIOS, including plots and intermediate products.
1. Plots#
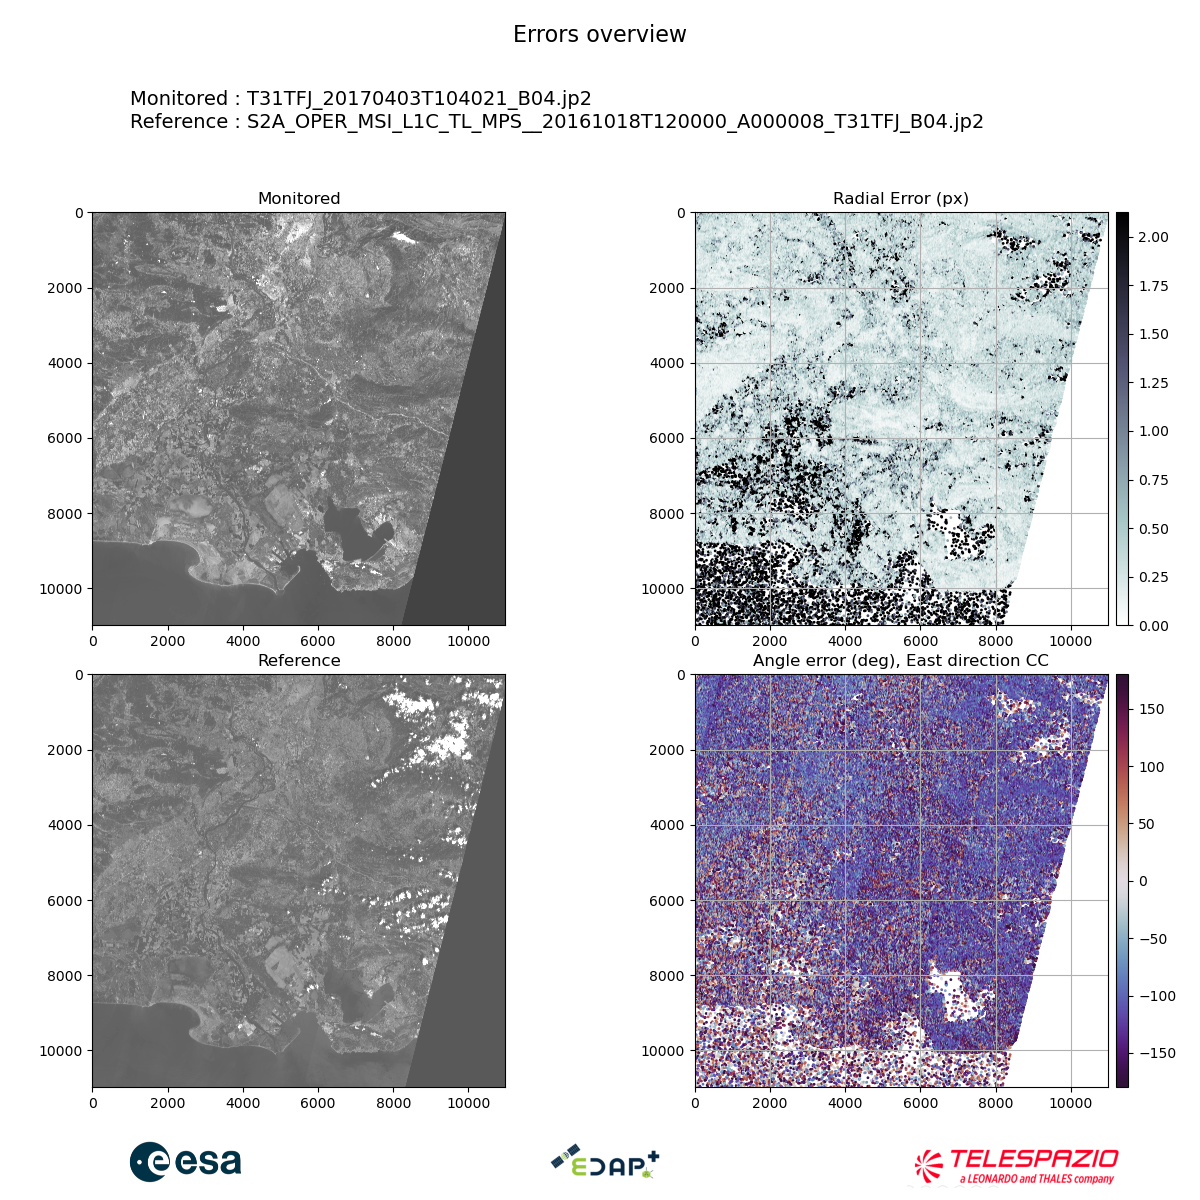
1.1 Error overview maps#
The error overview maps show the monitored image, reference on the left and the keypoints map on the right. For each point, the radial error in pixel (top) and the angle error (bottom) are displayed.
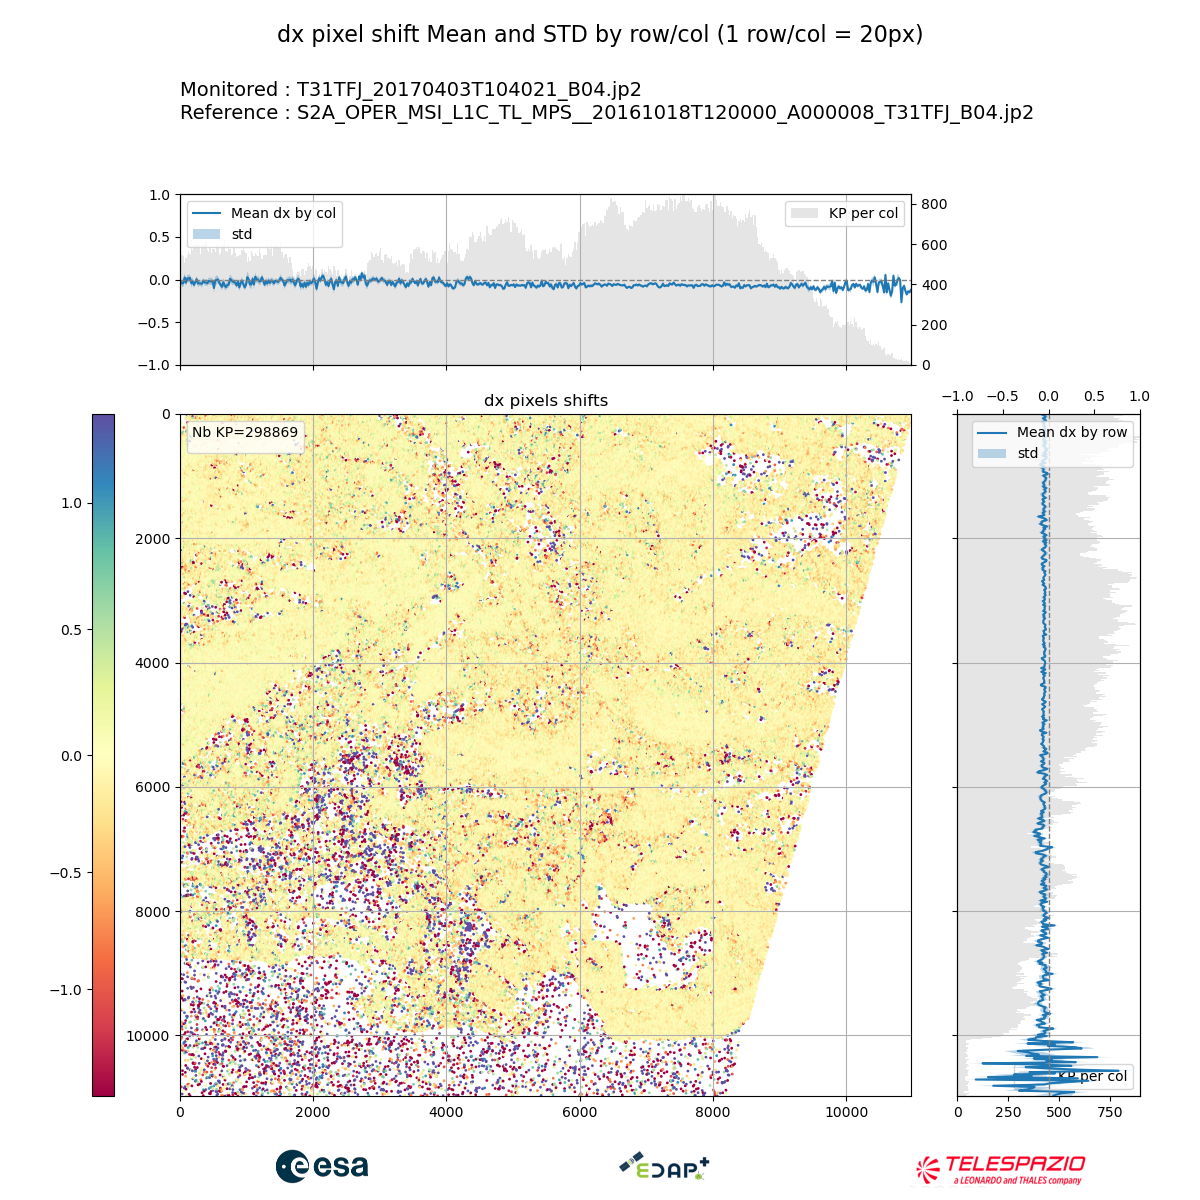
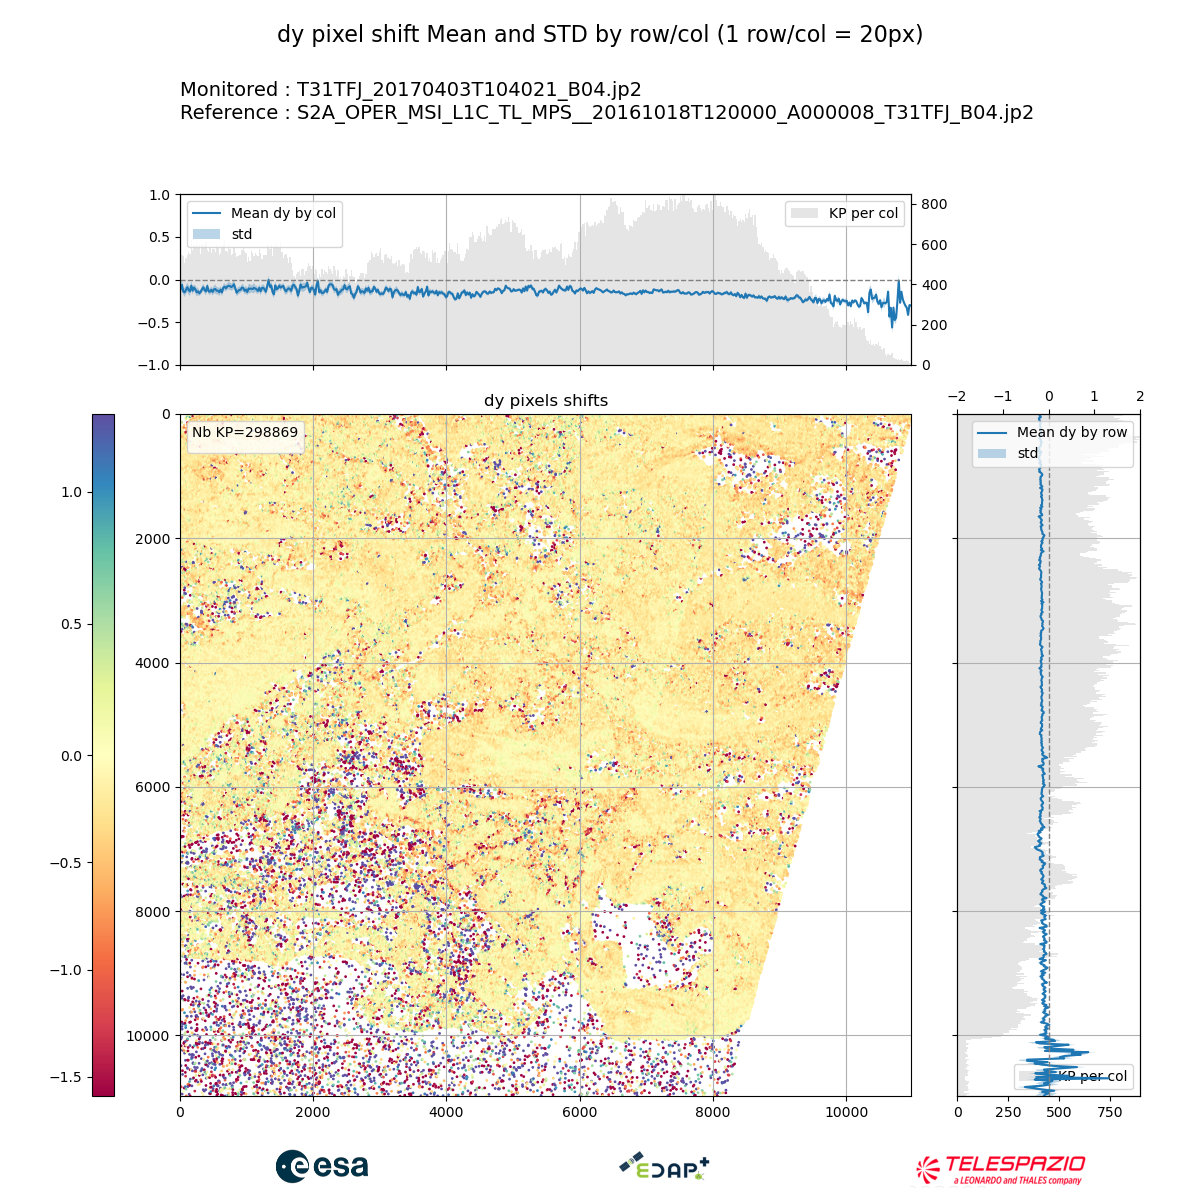
1.2 X/Y pixel shift by rows and columns#
These outputs show the pixel shift mean and standard deviation by rows and columns, for both x and y directions.
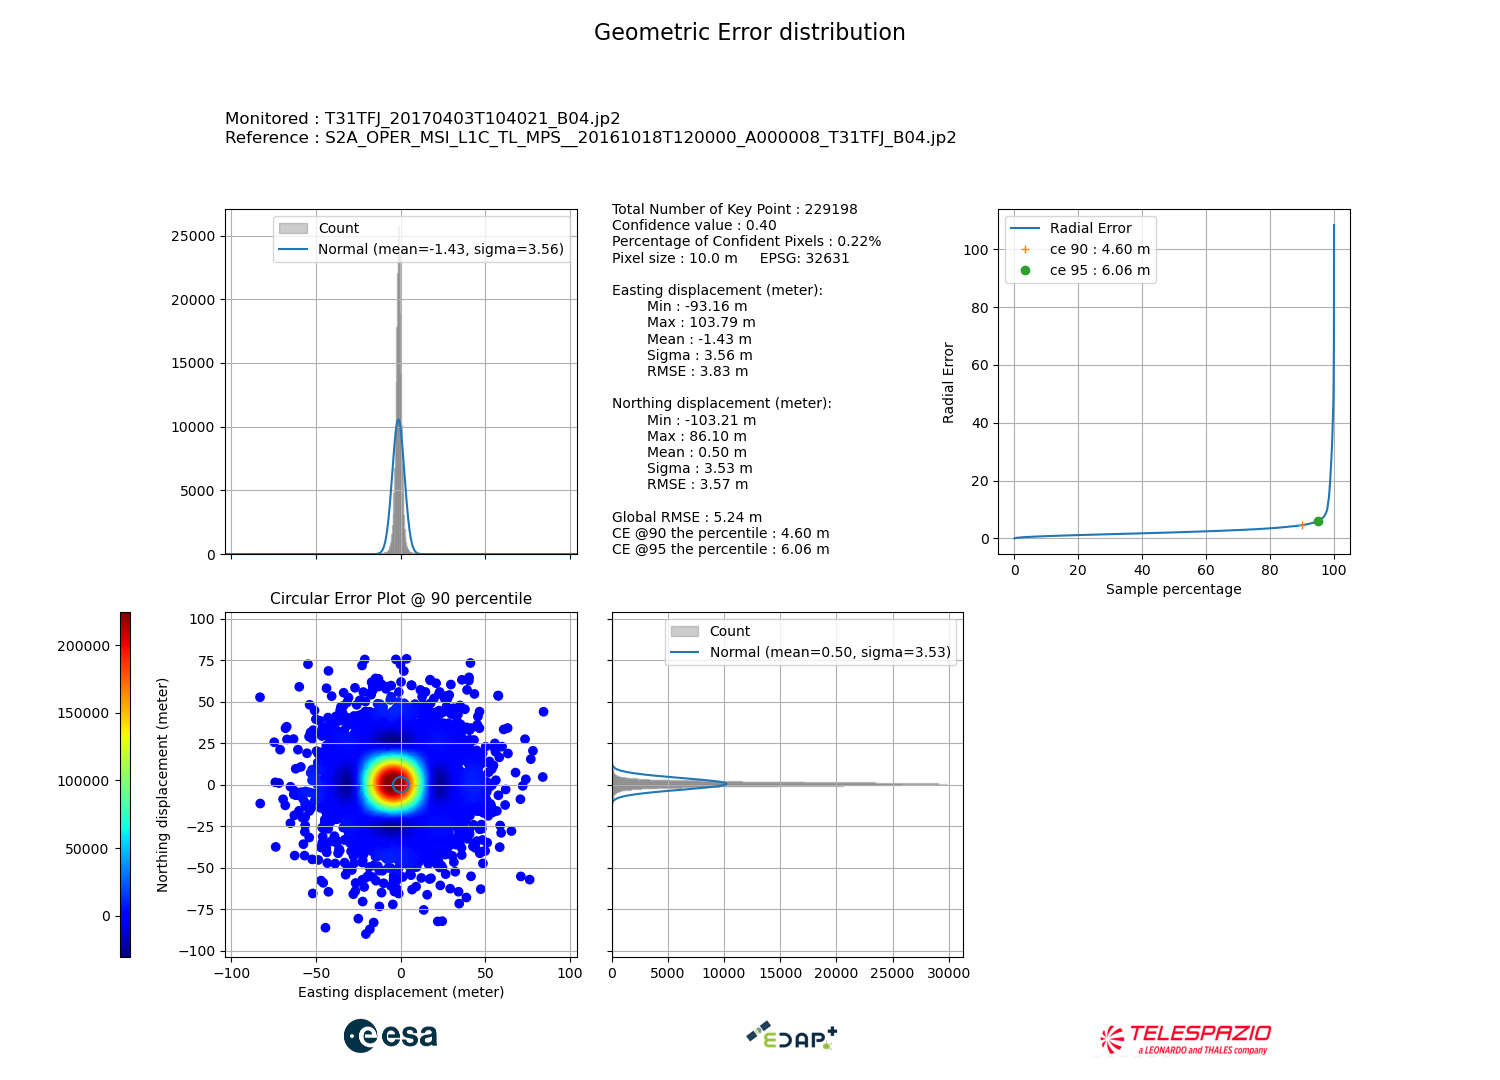
1.3 Geometric Error Distribution#
This output provides :
The circular error graph that gives a global view on the pixel shift distribution and the geometric shift tendencies, as well as the histograms in both directions with mean/sigma values.
The global statistics: min, max, mean, STD, RMSE.
The radial error plot with circular error (90%/95%).
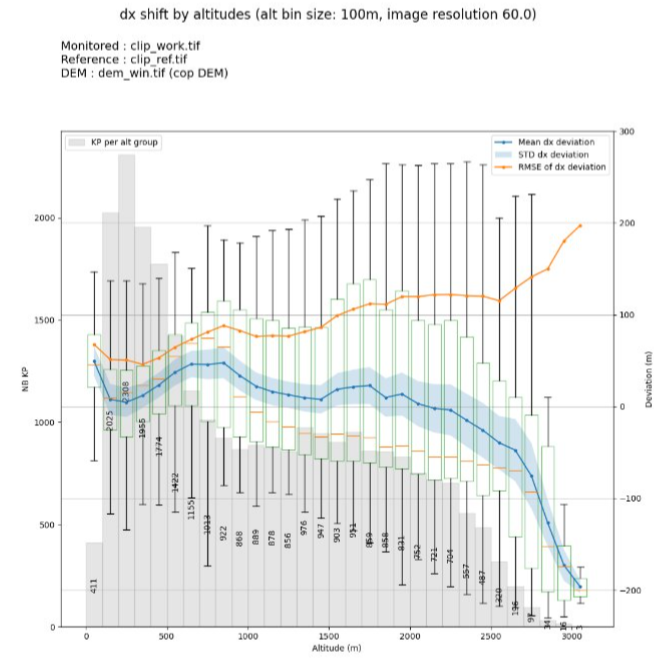
1.4 Geometric shift by altitudes distribution#
This output provides the evolution of the mean / STD / RMSE of the deviation against elevation values, groupped as bins. These plots are generated if the DEM is provided in the KARIOS command line (–dem) and contain :
A plot for the dx deviation
A plot for the dy deviation
A plot for radial error
2. Files#
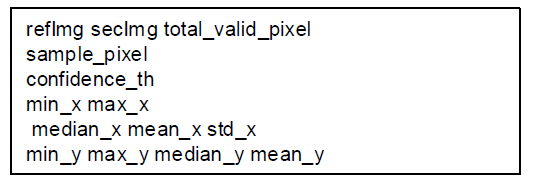
2.1 TXT File#
This file contains all the global useful information to be easily extracted :
Monitored image name
Reference image name
Total number of valid pixels
Pixel sampling
Confidence threshold for accuracy analysis
Min/max values in x/y
Median/Mean/STD values in x/y
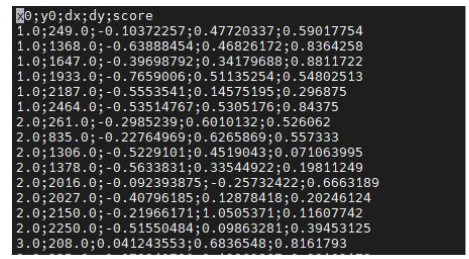
2.2 CSV File#
This file contains for every detected corner :
The x/y coordinates
The shift along x/y in meters
The confidence score
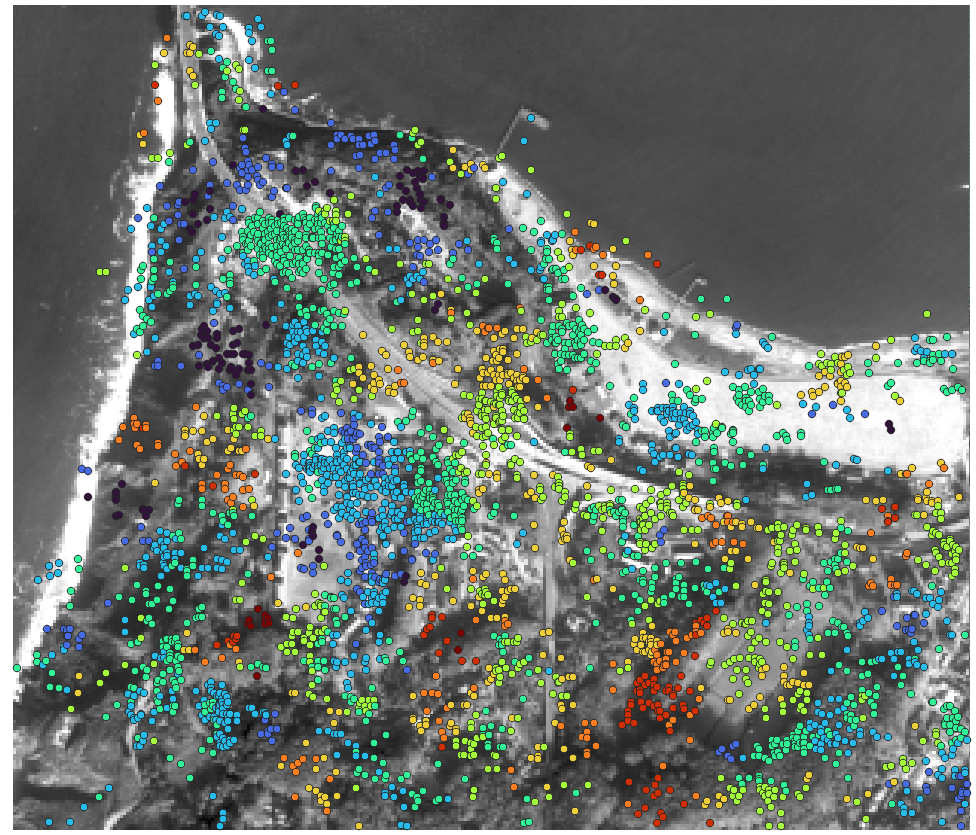
2.3 Key points mask#
This mask is a GeoTIFF file containing for each detected keypoint :
dx/dy shift in pixel
Confidence score
Radial error
Angle error
ZNCC score if available
This file is also available as a JSON file that can be viewed on QGIS :
2.4 Laplacian images#
The Laplacian image is the 2D second derivative of the input images (monitored and reference) which is used in the KLT process as the basis to detect corners. It can be useful to examine these images to see if they are similar and comparable, as they are determinant for corners detection.
This output can be activated by using –generate-intermediate-product.
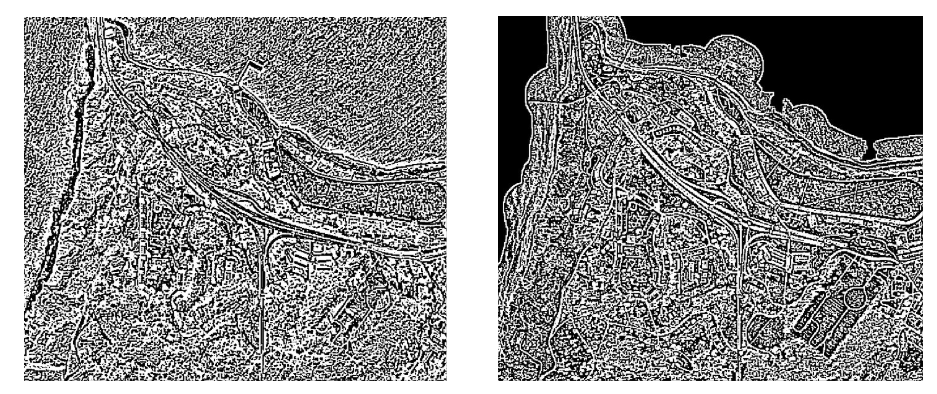
Computed laplacian - Skysat / USGS LiDAR at 3 meters#
Note
You can cite KARIOS Tool by using Saunier, S., Canonicy, P., Louis, J., Debaecker, V., & Albinet, C. (2024). KARIOS : A fast & efficient open source tool for geometric deformation analysis (1.0). The Very High-resolution Radar & Optical Data Assessment (2023) Workshop (VH RODA), ESA-ESRIN, Frascati (Italy)
Many thanks to Telespazio for this open source tool.